Logging vs Tracing
Monitoring is one of the essential parts to check how well your application is doing and to get some insights if there is a possible disaster coming in. Sifting through logs works perfectly well for standalone applications, but what about more complex scenarios or even distributed ones?
In this post I want to demonstrate the difference between logging and tracing and talk about why and when I’d prefer one over the other. We are going to cover some basics first and talk about what both actually is and about possible ways to enrich them. And after that, we are going to do a side-by-side comparison and talk about their strengths and weaknesses for specific usecases.
Are you still with me? Great - let us move on to logging!
Logging &
What is a log? &
Generally speaking, a log is some kind of output of an event that happened on an application on a specific system at a particular time. And these logs can be pure informational, like when a user sends a request to your service, but can also turn the page and deliver helpful bits of information for troubleshooting during an outtake.
One problem with log messages is the sheer amount of data that is generated during daily business, which makes it quite difficult to keep track of them and to find something specific. To keep them manageable, they are grouped into different categories (called levels) like Info, Warn or Error (depending on their severity) and can be used to filter data or to create monitoring alarms.
Here is an example of a message:
LOGGER.info("Created todo");2022-01-19 16:46:14,298 INFO [dev.une.sho.tod.ada.TodoResource] (executor-thread-0) Created todoAdding context &
Simple messages, like this don’t provide much contextual information and make it difficult to reproduce what has actually happened. Adding useful information like request-, user- or other object identifiers further improves your understanding and also makes it possible to correlate different messages. A good approach here is to consider the log as a journal of your application with details for all events.
LOGGER.info("Created todo: id={}", todo.getId());2022-01-19 16:46:14,298 INFO [dev.une.sho.tod.ada.TodoResource] (executor-thread-0) Created todo: id=8659a492-1b3b-42f6-b25c-3f542ab11562This works for single messages, but what if we have more than one message?
Doing this manually can be a labor intensive and error-prone task and a single deviation makes it really difficult to find the message:
LOGGER.info("Created todo: id ={}", todo.getId());Mapped Diagnostic Context &
Modern logging libraries support the usage of a MDC, which allows to add information via static methods to a thread-based context. If your logger is configured correctly, this information is automatically added to the next log messages until you remove it again:
/* Manual MDC handling */
MDC.put("todo_id", todo.getId());
LOGGER.info("Created todo");
MDC.remove("todo_id");

/* try-with-resources block */
try (MDC.MDCCloseable closable = MDC.putCloseable("todo_id", toto.getId())) {
    LOGGER.info("Created todo");
}
Unfortunately, the default logger of Quarkus needs a bit of configuration until it actually picks up the MDC information:
quarkus.log.console.format=%d{yyyy-MM-dd HH:mm:ss,SSS} %-5p [%c{2.}] (%t) %X %s%e%nAfter this change the log dutifully includes our value:
2022-01-19 16:46:14,298 INFO [de.un.sh.to.ad.TodoResource] (executor-thread-0) {todo_id=8659a492-1b3b-42f6-b25c-3f542ab11562} Created todoThese parameters can either be added manually or automatically via filters, interceptors or even with aspect-oriented-programming and allow writing of better filter queries for our values.
Correlation between messages &
Another way to correlate between messages is to create an unique id or correlation id for each request and add it to all consecutive log messages.
The combination of both MDC and interceptors make it really easy to add this to your existing applications:
@Target({ METHOD })
@Retention(RUNTIME)
@Documented
@InterceptorBinding
public @interface Correlated { (1)
}| 1 | Create a marker annotation for the actual binding of our interceptor |
@Correlated
@Priority(10)
@Interceptor
public class CorrelatedInterceptor {

    @AroundInvoke
    public Object correlate(InvocationContext context) throws Exception {
        Object result = null;

        try (MDC.MDCCloseable closable = MDC.putCloseable("correlation_id",
                UUID.randomUUID().toString())) (1)
        {
            result = context.proceed(); (2)
        }

        return result;
    }
}| 1 | Create a new ID here and put it into the MDC. |
| 2 | Actual call the intercepted method and pass down our new id. |
@POST
@Consumes(MediaType.APPLICATION_JSON)
@Operation(summary = "Create new todo")
@Tag(name = "Todo")
@APIResponses({
        @APIResponse(responseCode = "200", description = "Todo created")
}
@Correlated (1)
public Response create(TodoBase todoBase) {
    LOGGER.log("Received post request");

    return Response.ok().build();
}| 1 | And this finally marks the method for being intercepted. |
Once we restart our service and fire a POST request against our service the log should include something like this:
2022-03-05 14:30:06,274 INFO [de.un.sh.to.ad.TodoResource] (executor-thread-0) {correlation_id=f825c6981cb0dc603eb509189ed141b6} Received post requestStructured logs &
To further improve the searchability (is that even a word?), switching from an unstructured to a structured format allows to parse the data more easily and to better include additional metadata like the calling class or the host name. The defacto standard for structured logs is JSON and supported widely in (business) analytics. : The quarkus-logging-json extension adds this capability:
{
  "timestamp": "2022-02-04T17:23:34.674+01:00",
  "sequence": 1987,
  "loggerClassName": "org.slf4j.impl.Slf4jLogger",
  "loggerName": "dev.unexist.showcase.todo.adapter.TodoResource",
  "level": "INFO",
  "message": "Created todo",
  "threadName": "executor-thread-0",
  "threadId": 104,
  "mdc": {
    "todo_id": "8659a492-1b3b-42f6-b25c-3f542ab11562"
  },
  "hostName": "c02fq379md6r",
  "processName": "todo-service-create-dev.jar",
  "processId": 97284
}| More advanced logging libraries provide helpers based on the mechanism of the MDC to add key-value pairs conveniently. |
Here are few examples:
/* quarkus-logging-json */
LOGGER.info("Created todo", kv("todo_id", todo.getId()));

/* Logstash */
LOGGER.info("Created todo", keyValue("todo_id", todo.getId()));

/* Echopraxia */
LOGGER.info("Created todo", fb -> fb.onlyTodo("todo", todo));
The first two use helpers to add the specific key-value pair to the log. Echopraxia introduces the concept of field builders, which allow to define your own formatters for your objects to programmatically include all the necessary attributes.
Central logging &
One of the goals of central logging is to have everything aggregated in one place and to provide some kind of facility to create complex search queries. There are literally hundreds of other posts about the different solutions and we are going to focus on EFK and gelf.
Quarkus comes with an extension, that does the bulk work for us. All we have to do is just to include it and configure it for our setup:
<dependency>
    <groupId>io.quarkus</groupId>
    <artifactId>quarkus-logging-gelf</artifactId>
</dependency>quarkus.log.handler.gelf.enabled=true
#quarkus.log.handler.gelf.host=localhost (1)
quarkus.log.handler.gelf.host=tcp:localhost
quarkus.log.handler.gelf.port=12201
quarkus.log.handler.gelf.include-full-mdc=true| 1 | Noteworthy here is gelf uses UDP by default, so if you want to use Podman please keep in mind its gvproxy doesn’t support this yet. |
It might take a bit of time due to caching and latency, but once everything has reached Kibana you should be able to see something like this:
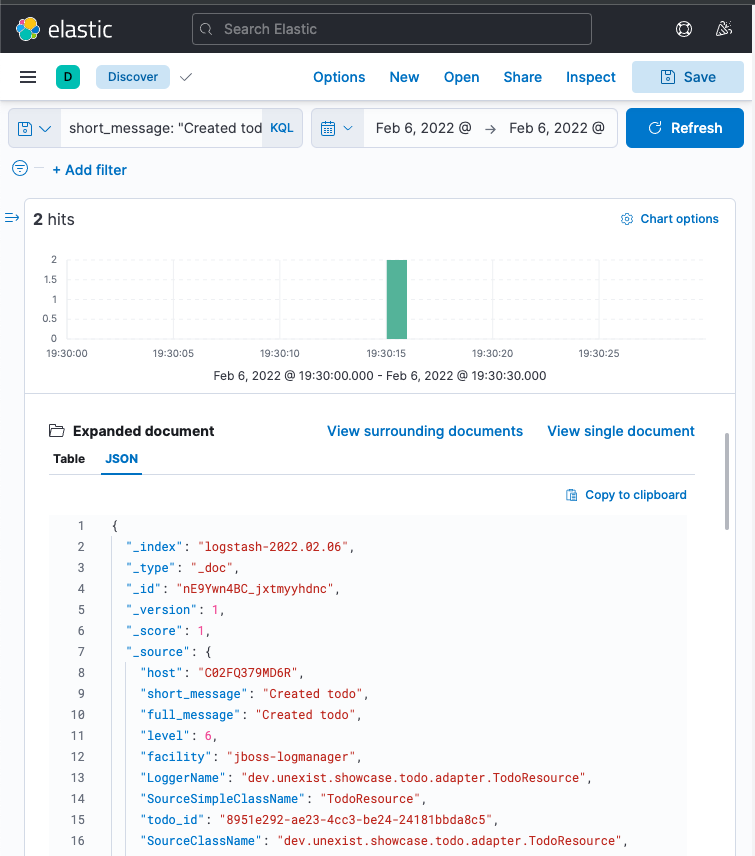
Another way to gather information is tracing, so let us have a look at it.
Tracing &
What is a trace? &
Again at a high level, a trace is a visualization of a request of its way through a service or a complete microservice environment. When it is created, it gets an unique trace ID assigned and collects spans on every step it passes through.
These spans are the smallest unit in the world of distributed tracing and represent any kind of workflow of your application, like HTTP requests, calls of a database or message handling in eventing. They include a span ID, specific timings and optionally other attributes, events or statuses.
Whenever a trace passes service boundaries, its context can be transferred via context propagation and specific headers for e.g. HTTP or Kafka.
Tracing with OpenTelemetry &
When I originally started with this post, Quarkus was about to make the switch from OpenTracing to OpenTelemetry and I had to start from scratch - poor me.
Similar to logging, Quarkus or rather Smallrye comes with an extension to bring tracing capabilities onto the table. This also enables rudimentary tracing to all HTTP requests by default:
@POST
@Consumes(MediaType.APPLICATION_JSON)
@Operation(summary = "Create new todo")
@Tag(name = "Todo")
@APIResponses({
        @APIResponse(responseCode = "200", description = "Todo created")
})
public Response create(TodoBase todoBase) {
    return Response.ok().build();
}
Without some kind of visualization it is difficult to explain what traces actually look like, so we fast forward a bit and configure OpenTelemetry and Jaeger.
Again, Quarkus comes with some handy extensions and all we have to do is to actually include
them in our pom.xml and to update our properties:
<dependency>
    <groupId>io.quarkus</groupId>
    <artifactId>quarkus-opentelemetry-exporter-otlp</artifactId>
</dependency>
<dependency>
    <groupId>io.opentelemetry</groupId>
    <artifactId>opentelemetry-extension-trace-propagators</artifactId>
</dependency>quarkus.opentelemetry.enabled=true
quarkus.opentelemetry.tracer.exporter.otlp.endpoint=http://localhost:4317
quarkus.opentelemetry.propagators=tracecontext,baggage,jaegerWhen set up properly your trace should look like this in Jaeger:
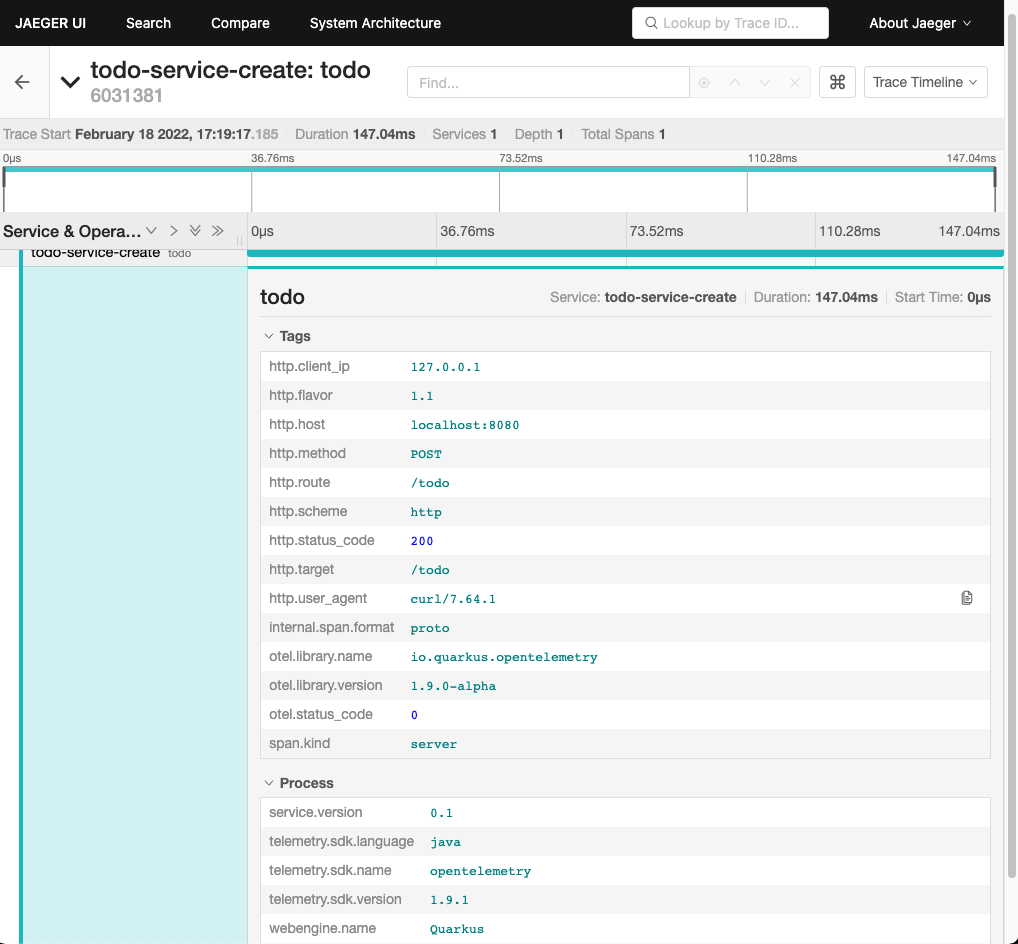
There is various meta information included like timing, client_ip or HTTP method and everything is provided automatically by the OpenTelemetry integration. Getting this for free is nice, but a single span is nbo big help and we still need to see how we can enrich this even further.
Spans in action &
The next example adds another service call with its own span to the previous example, demonstrates how they can be connected to each other and how to add more details.
@Inject
TodoService todoService;

@POST
@Consumes(MediaType.APPLICATION_JSON)
@Produces(MediaType.APPLICATION_JSON)
@Operation(summary = "Create new todo")
@Tag(name = "Todo")
@APIResponses({
        @APIResponse(responseCode = "201", description = "Todo created"),
})
public Response create(TodoBase todoBase, @Context UriInfo uriInfo) {
    Response.ResponseBuilder response;

    Span.current()
            .updateName("Received post request"); (1)

    Optional<Todo> todo = this.todoService.create(todoBase); (2)

    if (todo.isPresent()) {
        Span.current()
                .setStatus(StatusCode.OK, todo.get().getId()); (3)

        URI uri = uriInfo.getAbsolutePathBuilder()
                .path(todo.get().getId())
                .build();

        response = Response.created(uri);
    }

    return response.build();
}| 1 | Update the name of the current default span. |
| 2 | Create a new todo via service call. |
| 3 | Set status code of the current span. |
@WithSpan("Create todo") (1)
public Optional<Todo> create(TodoBase base) {
    Todo todo = new Todo(base);

    todo.setId(UUID.randomUUID().toString());

    Span.current()
            .addEvent("Added id to todo", Attributes.of(
                    AttributeKey.stringKey("id"), todo.getId())) (2)
            .setStatus(StatusCode.OK); (3)

    return Optional.of(todo);
}| 1 | Create a new span in the current context. |
| 2 | Add a logging event with the todo id to the current span. |
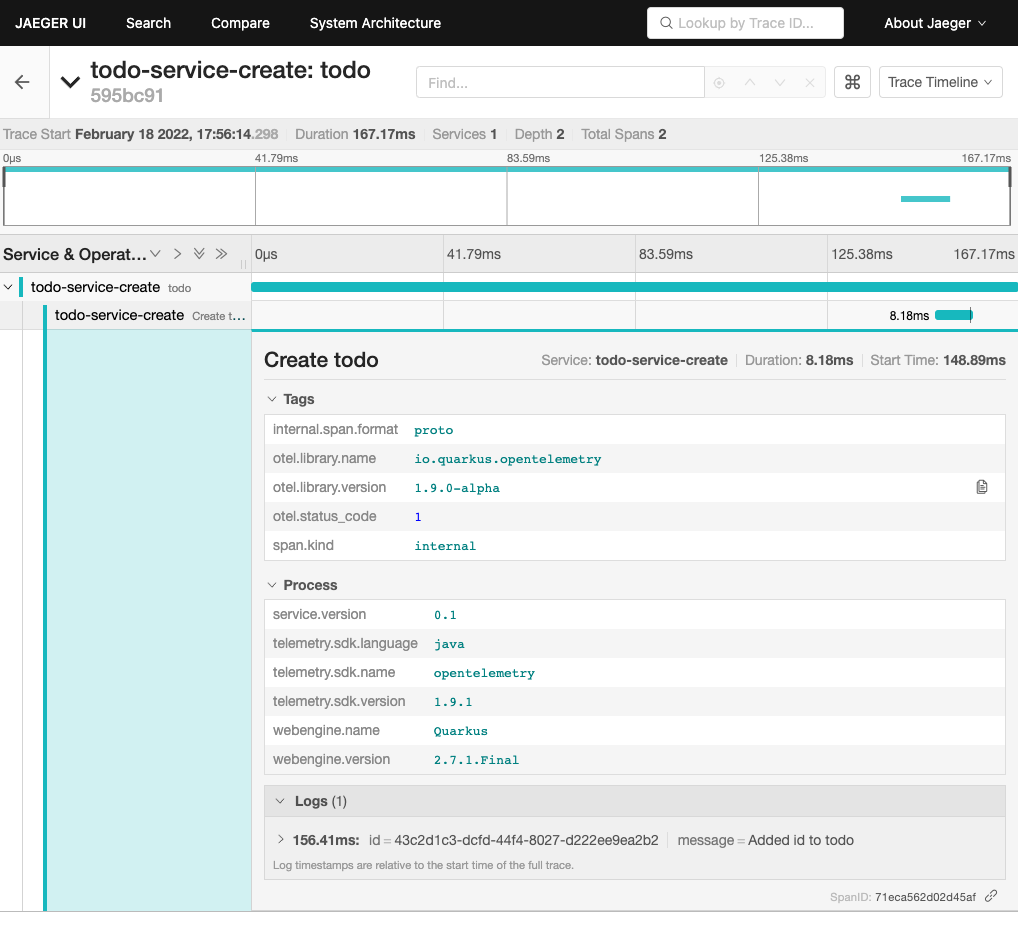
| 3 | Set status code of the current span. |
Once sent to Jaeger something like this can be seen there:
Jaeger also includes an experimental graph view to display the call graphs:
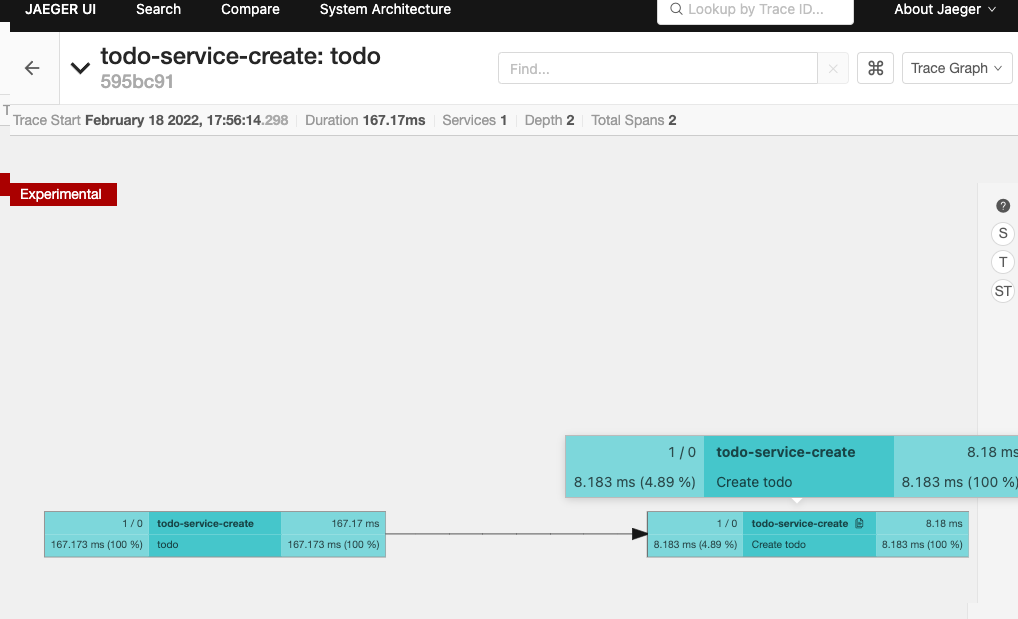
Even more spans &
More complexity? Let us throw in a bit of Kafka, since I've already mentioned context propagation:
@Inject
TodoService todoService;

@Inject
TodoSource todoSource;

@POST
@Consumes(MediaType.APPLICATION_JSON)
@Produces(MediaType.APPLICATION_JSON)
@Operation(summary = "Create new todo")
@Tag(name = "Todo")
@APIResponses({
        @APIResponse(responseCode = "201", description = "Todo created"),
})
public Response create(TodoBase todoBase, @Context UriInfo uriInfo) {
    Response.ResponseBuilder response;

    Span.current()
            .updateName("Received post request");

    Optional<Todo> todo = this.todoService.create(todoBase);

    if (todo.isPresent()) {
        Span.current()
                .setStatus(StatusCode.OK, todo.get().getId());

        this.todoSource.send(todo.get()); (1)

        URI uri = uriInfo.getAbsolutePathBuilder()
                .path(todo.get().getId())
                .build();

        response = Response.created(uri);
    }

    return response.build();
}| 1 | Send the todo object as a message to the broker. |
public class TodoSink {
    @ConfigProperty(name = "quarkus.application.name")
    String appName;

    @Inject
    TodoService todoService;

    @Incoming("todo-stored")
    public CompletionStage<Void> consumeStored(IncomingKafkaRecord<String, Todo> record) {
        Optional<TracingMetadata> metadata = TracingMetadata.fromMessage(record); (1)

        if (metadata.isPresent()) {
            try (Scope ignored = metadata.get().getCurrentContext().makeCurrent()) { (2)
                Span span = GlobalOpenTelemetry.getTracer(appName)
                        .spanBuilder("Received message from todo-stored").startSpan(); (3)

                if (this.todoService.update(record.getPayload())) {
                    span.addEvent("Updated todo", Attributes.of(
                            AttributeKey.stringKey("id"), record.getPayload().getId())); (4)
                }

                span.end(); (5)
            }
        }

        return record.ack();
}| 1 | Load metadata from current message. |
| 2 | Activate context from metadata. |
| 3 | Create a span builder and start new span. |
| 4 | Set status code of the current span. |
| 5 | And close the span at the end. |
And when finally everything comes together:
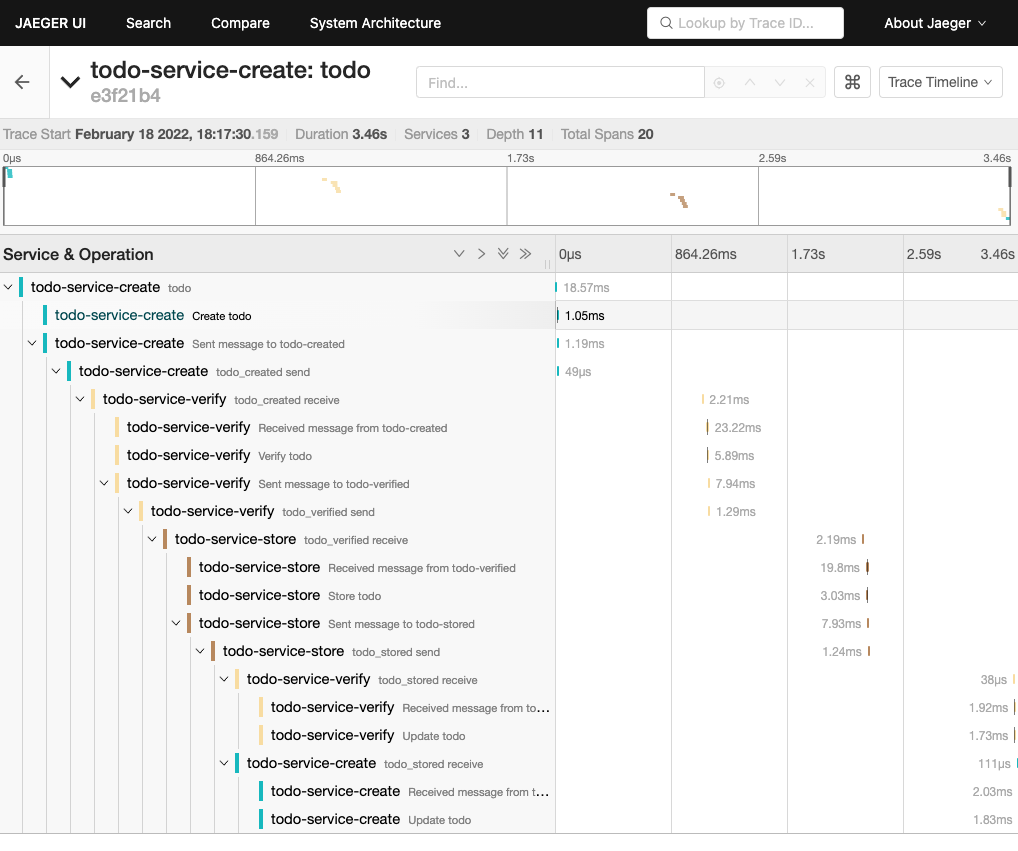
| I am going to describe the exact scenario there in a follow-up post. |
Combining logging and tracing &
Currently, there is no easy way in OpenTelemetry to add a trace or span id to your logs, but in general both can be used like a correlation id from the logging example with interceptors.
When we fetch the trace id from the current context, we can append it to the MDC and et voila:
@Traced
@Priority(10)
@Interceptor
public class TracedInterceptor {

    @AroundInvoke
    public Object trace(InvocationContext context) throws Exception {
        Object result = null;

        try (MDC.MDCCloseable closable = MDC.putCloseable("trace_id",
                Span.current().getSpanContext().getTraceId())) (1)
        {
            result = context.proceed();
        }

        return result;
    }
}| 1 | Fetch the trace id from the context |
Conclusion &
Logging and tracing aren't mutual exclusive, they both help to pinpoint problems and provide a different view of the same picture with a complementary set of information.
Logging |
Tracing |
Provides insights into single applications |
Helps to track requests through applications |
Captures the state of an application |
Tells request timings and component latencies |
Can be easily applied to code |
Adds more complexity to the code |
Is easy to integrate into monoliths |
Makes more sense in microservice architectures |
Supports debugging and diagnoses |
Supports debugging and diagnoses |
If you have a microservice architecture it probably makes more sense to enable tracing, than in your typical monolith, especially when this kind of instrumentation increases the overall complexity. Logging and tracing are two third of Three Pillars of Observability and help your development teams to debug errors, diagnose issues and to build better systems.
If you consider both now, which one would you prefer for what situation?
All of the examples can be found here: